
SaaS Conversion Funnel Audit: How to Find and Fix Leaks
If your SaaS signups look healthy but revenue is flat, you probably have leaks in your conversion funnel. I’ve audited growth funnels for early stage startups and scaleups, and I can tell you that a few focused fixes often unlock the most impact. This post walks you through a practical SaaS conversion funnel audit you can run this week, with simple examples, common pitfalls, and clear next steps.
Why run a funnel audit
A funnel audit shows where prospects drop off across the customer journey. You can think of the funnel as conversion funnel stages: awareness, acquisition, activation, retention, and revenue. Each stage has its own metrics and opportunities. When you analyze them together, you spot sales funnel leaks that single metrics hide.
In my experience, teams often optimize the top of funnel while ignoring activation and retention. That usually wastes marketing spend and makes lead-to-customer conversion painfully slow. A funnel audit gives you a roadmap for funnel optimization strategies that improve ROI and product-market fit.
What you’ll gain from this audit
- Clear diagnosis of where people drop off in your SaaS growth funnel
- Actionable ideas to improve improving SaaS signups and activation
- Priority list of experiments that move the needle on revenue
- Data-backed recommendations to improve lead-to-customer conversion
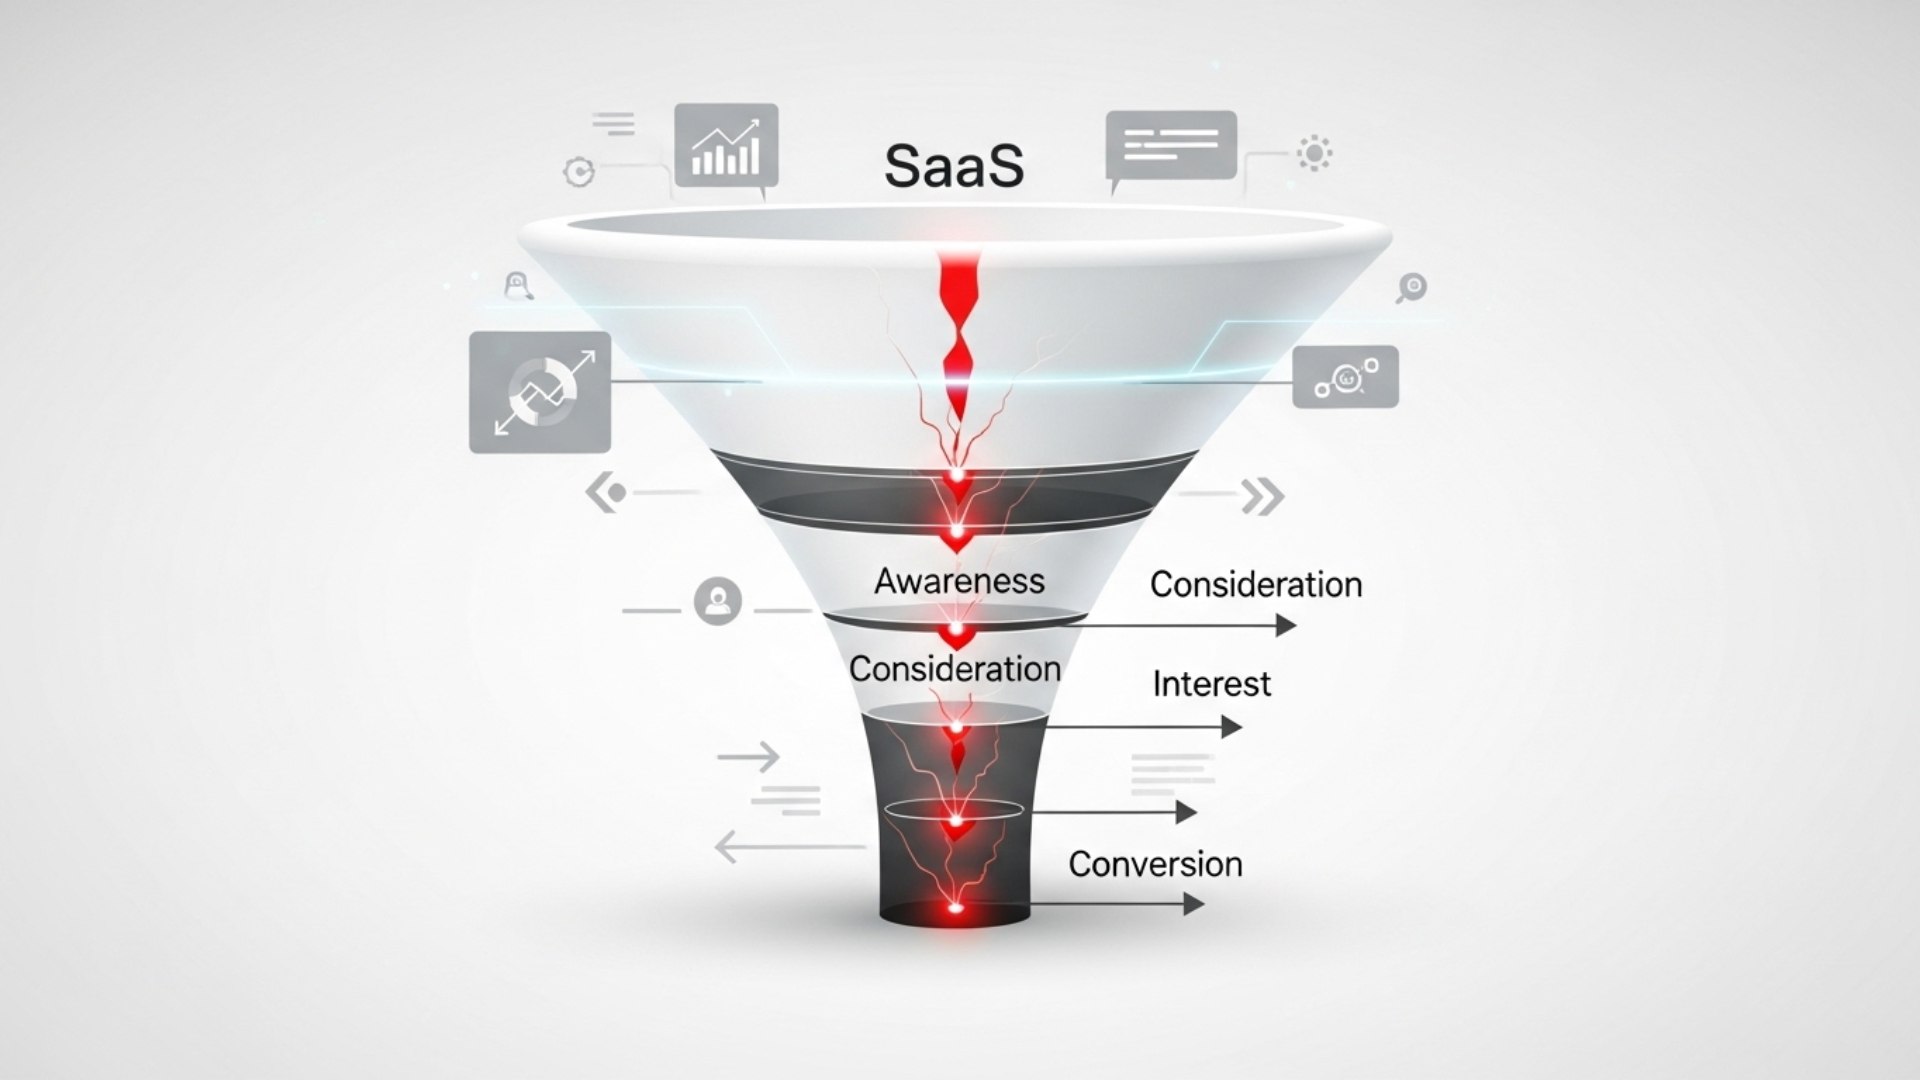
Quick overview of conversion funnel stages
Before diving into the audit steps, let’s define the conversion funnel stages so we use the same language.
- Awareness: People learn about your product through content, ads, referrals, or organic search.
- Acquisition: Visitors arrive on your site or app. You capture them as leads, trial users, or signups.
- Activation: Users reach their first success moment. They experience value within the product.
- Retention: Users keep returning and using your product over time.
- Revenue: Users become paying customers and ideally upgrade or refer others.
These stages form the SaaS conversion funnel, and your audit should measure each stage precisely.
Step 1: Define your funnel and critical conversion events
The first mistake I see is fuzzy definitions. If marketing, product, and sales don't agree on what counts as a signup or activation, your metrics lie. Start by writing down specific conversion events, then instrument them in analytics tools.
Example definitions you can copy and adapt
- Visit to homepage, product page, and pricing page
- Signups: users who create an account and confirm email
- Trials: users who start a free trial or request a demo
- Activation: users who complete the key action that proves value, for example uploading first file, sending first message, or connecting an integration
- Paid conversion: users who enter billing information and become paying customers
Use one analytics source of truth. I recommend tools like Google Analytics for web traffic, and Mixpanel or Amplitude for event-level user tracking. Heatmaps and session replay tools like Hotjar or FullStory add qualitative context.
Step 2: Instrument tracking and fix data gaps
Tracking errors are where audits go to die. If you don’t trust your data, you waste time chasing ghosts. Audit the instrumentation first.
Checklist to validate tracking
- Confirm events fire consistently for account creation, trial start, activation, and billing events
- Map user identifiers across systems so you can follow a visitor from ad click to paid conversion
- Check that UTM and referral parameters persist through signup flows
- Verify that analytics capture conversion context, like source, campaign, and plan chosen
Quick example. If your trial start event fires only when users reach a particular page, but some users start trials in-app through a widget, your trial numbers will look low. Fix that by tracking both paths and unifying events under a single name.
Step 3: Establish baseline metrics and benchmarks
Measure current performance before you change anything. Baselines help you know what’s working. Track conversion rates between stages and the absolute counts so you prioritize the largest leaks.
Core metrics to capture
- Traffic to signup conversion rate
- Signup to activation conversion rate
- Activation to trial-to-paid or paid conversion rate
- Time to activation and time to first value
- Churn rates at 7, 30, and 90 days
- Average revenue per user and customer acquisition cost
Benchmarks vary by product and business model. For simple B2B SaaS, a signup to paid rate of 2 percent can be normal. For product-led growth tools, that number can be 5 percent or higher if onboarding is tight. Use benchmarks to decide whether to aim for optimization or redesign.
Step 4: Visualize the funnel and segment it
A single funnel view usually hides patterns. Segment your funnel by source, campaign, pricing plan, company size, and behavior. I often spot that one channel converts much better than others or that enterprise signups need a different onboarding flow.
Useful segment ideas
- Organic search versus paid ads
- Inbound demos versus self-serve signups
- Company size or role, like developer versus product manager
- Feature usage segments, for example users who use integrations versus those who don’t
When you break funnels into segments, patterns appear. You might find that signups from a content campaign activate at twice the rate of ads. That tells you to double down on content and fix the ad landing page.
Step 5: Find the biggest leaks
Now that you have a clean funnel and segments, look for the largest percentage drop between stages in terms of absolute users lost. Prioritize the largest leaks that are easiest to fix.
Common leaks I see
- High drop off on the pricing page because plans are confusing
- Low activation because the product requires too many steps to show value
- Many free trials that never reach the activation metric
- Paid conversions that stall at the payment form
- Retention dips after month one due to onboarding gaps
Example. Suppose you acquire 10,000 visitors a month. If 1,000 sign up, 300 activate, and 60 convert to paid, your conversion rates are: 10 percent site to signup, 30 percent signup to activation, and 20 percent activation to paid. To get to 120 paid customers, you could improve signup to activation from 30 percent to 40 percent. That is often easier than doubling traffic.
Step 6: Diagnose causes with qualitative research
Numbers tell you where people drop off. Qualitative research tells you why. Use session recordings, user interviews, and customer support transcripts to diagnose friction.
Practical diagnostic tactics
- Watch session replays for users who dropped off at the signup or activation step
- Send short surveys to users who churned in the first 7 days
- Review support tickets to find repeated confusion about a feature or billing
- Run 5 to 10 user interviews with recent signups and churned users
I’ve noticed that small UX issues cause big leaks. For example, a confusing checkbox during signup or an unclear error message on a payment form can cost you tens of customers each month.
Step 7: Prioritize fixes with impact and effort
Once you have diagnoses, rank fixes by expected impact and implementation effort. I like a simple priority matrix with four buckets: quick wins, strategic bets, low priority, and do not do.
Examples of quick wins
- Clarify pricing language and remove friction on the billing form
- Add contextual help inside the product to guide activation
- Fix broken tracking and missing UTM parameters
- Create short onboarding checklists that lead users to activation
Strategic bets might include redesigning onboarding flows, building community features, or launching a major pricing update. Those can move the needle but take time.
Step 8: Design experiments and measure wins
Funnel optimization strategies are tests, not guesses. Use A/B tests or gradual rollouts and measure impact on the metric you care about. Keep experiments simple and focused on one hypothesis.
Experiment checklist
- Define one primary metric, for example activation rate or paid conversion
- Pick a measurable hypothesis, like changing CTA copy will increase trial starts
- Run the test until you reach statistical significance or a pre-determined sample size
- Document results and next steps, even for failed experiments
A test example. You suspect the pricing page scares users. Run an A/B test that compares the current pricing page to a simplified version that highlights two plans, customer logos, and an activation checklist. Measure both signup rate and time to activation. If simplified pricing increases signup by 18 percent and leads to the same activation rate, you’ve got a clear win.
Step 9: Improve onboarding and time to value
Activation is the most critical stage in the SaaS growth funnel. If users never get to value quickly, they churn before they pay. Focus relentlessly on time to value, which is how long it takes a user to experience the core benefit.
Onboarding tactics that reduce time to value
- Remove unnecessary steps in the signup flow and reduce required fields
- Use progressive disclosure to introduce advanced features later
- Offer templates or pre-populated data so users can complete a key action faster
- Guide new users with in-app prompts and checklists that lead them to activation
Concrete example. For a collaboration tool, your activation metric might be "team creates first shared project." If average time to that event is four days, add a step in onboarding to import a template project and invite a teammate. That can cut time to value to 30 minutes and dramatically increase activation.
Step 10: Fix pricing and billing friction
Pricing leaks are subtle. Users often abandon at checkout because plans are unclear, the billing form is long, or they don’t see the value of paid tiers. Fixing pricing friction can boost conversions quickly.
Checklist to reduce billing friction
- Provide clear plan differences, including usage examples and who each plan is for
- Use shorter billing forms and offer payment method alternatives like Stripe, PayPal, or invoicing
- Show a “what you get” summary during checkout so users know the value they’re buying
- Offer trials, freemium, or credit cards required only after activation to reduce risk
Tip. If you expect enterprise deals, present a clear path from self-serve to demo or sales-assisted upgrades. That prevents mid-market prospects from getting stuck in a flow designed for startups.
Step 11: Close the loop with retention and expansion
Conversion is not done once customers pay. Retention and expansion turn one-time customers into repeat revenue and referrals. After you fix acquisition and activation, measure whether new customers stick around.
Retention tactics that actually work
- Set up onboarding sequences and product education that run after activation
- Monitor health signals, for example feature usage frequency, and trigger outreach when usage drops
- Create in-app prompts and lifecycle emails that encourage upgrades
- Use customer success check-ins for higher ARPU accounts
Common mistake. Teams treat onboarding as a one-time email welcome sequence. That rarely works. Onboarding should be an ongoing product experience with checkpoints at 7, 30, and 60 days.
Tools and instrumentation I recommend
Not every tool is necessary. Pick a set that fits your stack and team size. I prefer a combination of product analytics, session replay, and CRM integration so the team shares a single source of truth.
- Product analytics: Mixpanel, Amplitude, or Heap
- Web analytics: Google Analytics 4
- Session replay and heatmaps: Hotjar or FullStory
- Customer data platform or CDP for identity stitching: Segment or RudderStack
- Payments: Stripe or Braintree, with webhooks to your analytics
- Intercom or Drift for in-app messages and support
Integration tip. Send the same event names to analytics and your CDP. When product, marketing, and sales use the same event taxonomy, your funnel reports stay consistent and reliable.
Case study example: Small improvements, big impact
Here is a real style example based on work I’ve seen. A mid-stage SaaS product had these metrics: 5 percent traffic to signup, 25 percent signup to activation, and 15 percent activation to paid. They had 100,000 monthly visitors, resulting in 5,000 signups, 1,250 activations, and 187 paid users.
The audit found three key leaks: a confusing pricing page, a long activation path that required integration setup, and a payment form that rejected certain cards. They prioritized quick wins: simplify pricing, add a one-click demo project to shorten activation, and add fallback payment methods.
After three months of A/B tests and product changes they achieved: 6 percent traffic to signup, 35 percent signup to activation, and 20 percent activation to paid. With the same traffic, they now had 6,000 signups, 2,100 activations, and 420 paid customers. That doubled their monthly paid user count without a big ad spend increase.
Common mistakes and how to avoid them
- Confusing activation metric. Avoid vague activation definitions. Make it a measurable, meaningful action.
- Chasing vanity metrics. Signups can go up while revenue drops. Follow the full funnel to revenue.
- Overlooking tracking gaps. If events fire inconsistently, your conclusions will be wrong.
- Running too many experiments at once. Keep tests isolated to understand which change caused the effect.
- Ignoring onboarding. Activation usually drives the biggest long-term gains.
As a rule, document your assumptions. That saves time later when you revisit tests and results.
Checklist: A 90 minute audit you can run now
You can do a fast, meaningful audit in under two hours. Here is a prioritised checklist.
- Define the funnel events and activation metric. Confirm definitions with product and sales.
- Verify tracking for signup, activation, trial, and billing events in your analytics tool.
- Pull funnel conversion rates for the last 90 days and identify the biggest percentage and absolute drops.
- Segment the funnel by acquisition channel and plan to spot high-performing sources.
- Watch session replays for users who dropped off in the biggest leak stage.
- Interview 5 users who activated and 5 who churned in the first month.
- List three quick wins and one strategic bet, then prioritize by expected impact and effort.
How to report findings to stakeholders
Present funnels in plain language. Start with the headline leak, then explain your evidence and recommended fixes. Use visuals to show conversion stage drop offs. End with a prioritized list of experiments and expected lift.
Keep stakeholders engaged by focusing on revenue impact. Translate conversion rate improvements into expected monthly or annual revenue. That helps teams allocate engineering and marketing resources to the highest impact work.
Scaling your funnel audit process
Once you run a manual audit, build a repeatable process. Set up automated funnel reports and weekly triage to review changes. Use a shared dashboard so everyone can monitor the same funnel metrics.
Steps to scale
- Automate weekly funnel snapshots and send them to relevant teams
- Create a public audit backlog with experiments, owners, and timelines
- Run quarterly deep audits that include cohort analysis and LTV/CAC review
- Train growth, product, and sales teams on the shared event taxonomy
When to call in outside help
Doing your first funnel audit in-house is smart. But there are times when an external perspective speeds things up. Consider getting help when:
- You can’t link product events to revenue because your tracking is fragmented
- Your team is heads down shipping features but conversions still lag
- You need a rapid turnaround to hit a fundraising or fiscal milestone
At Agami Technologies Pvt Ltd, we often help SaaS teams run focused funnel audits that blend analytics, UX fixes, and experiment design. We tend to start with the data hygiene and the activation path because those drive quick wins.
Putting it all together: sample 30 day plan
Here is a practical 30 day plan you can implement to run a focused funnel audit and start experiments.
- Days 1 to 3: Define funnel events and fix tracking gaps
- Days 4 to 7: Pull baseline metrics, build funnel visualizations, and segment by source
- Days 8 to 12: Do qualitative research, session replays, and 10 user interviews
- Days 13 to 18: Prioritize fixes and design 2 to 4 experiments
- Days 19 to 30: Run experiments, track results, and document learnings
At the end of 30 days you should have a clear list of wins, a few validated experiments, and a repeatable process for ongoing funnel optimization.
Realistic expectations for improvements
People ask me what lift they should expect. There is no single answer, but here are realistic ranges based on typical audits I’ve seen.
- Quick wins like fixing a payment form or simplifying pricing can yield 10 to 40 percent lift in conversion at that stage
- Onboarding improvements that reduce time to value can boost activation by 20 to 100 percent depending on the product
- Redesigns or pricing changes are bigger bets and can double conversion if they align with customer needs
Remember that compounding matters. A 20 percent improvement at activation and a 20 percent improvement at pricing multiply through the funnel and produce much larger revenue gains.
Also Read:
Final thoughts
A funnel audit is not a one-time project. It is an ongoing practice that helps your team prioritize product work and marketing spend. Start with clear definitions, clean data, and focused experiments. Fix the biggest leaks first and measure everything.
In my experience, teams that treat activation as the center of the SaaS conversion funnel see the fastest path to revenue. If you want to move fast, keep experiments small, measure impact on revenue, and iterate quickly.
Helpful Links & Next Steps
- Agami Technologies Pvt Ltd
- Agami Technologies Blog
- Boost Your SaaS Growth with a Funnel Audit – Book a Free Demo Today!
If you want help running an audit or designing experiments, book a demo with Agami Technologies and we’ll walk through your funnel together. Boost Your SaaS Growth with a Funnel Audit – Book a Free Demo Today!